


The United States Is a Third World Country
The best explanation for the good old days is a bad memory

Is the title Clickbait? Of course. Most of you know I would never lean into a boring, overdone, overly-negative meme like calling the US a third world country. Instead, what I meant to say is that the United States was a third world country by today’s standards.
The purpose of this article is to point out two related consequences of rampant negativity bias. The first is that people tend to believe that the past was much better than it actually was. The second is that people tend to underestimate how good things are today, especially when improvements happen gradually.
One of the most common populist tropes on both the left and the right is the glorification of the bygone era when America was truly great, ruined by whatever current political issue each side would like to point to. There are a million versions of the meme below from both the populist left and the populist right that provide a good example of this type of “back in my day” thinking:
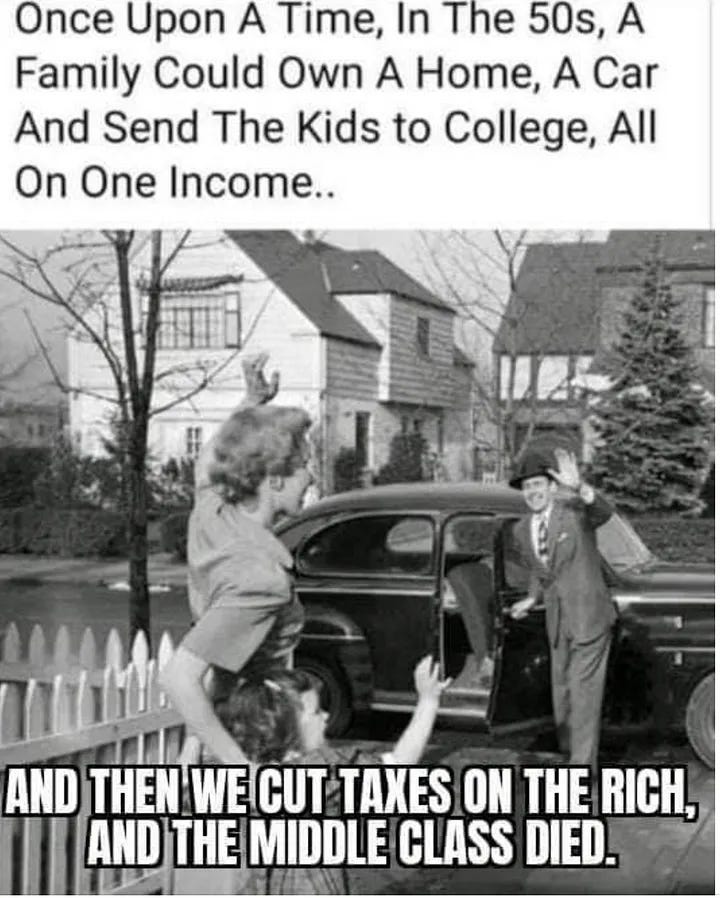
While some level of nostalgia is normal, taken to extremes, the mindset that everything in the past was sunshine and roses and everything today is horrible and getting worse actually gets a lot of attention in political psychology literature. Rosy Retrospection, a form of Declinism and a subset of negativity bias, refers to our tendency to recall the past more fondly than the present.
Of course, certain aspects of a given decade like clothes, music, or architecture, may be preferred depending on personal taste and can fit within the normal range of justified nostalgia. But to believe that the 1960’s, for example, offered a better standard of living and that subsequent failures of capitalism, democracy, the culture, or anything else, have led to a decline in quality of life is just factually incorrect. Yet today, pessimistic declinism is a dominant view for many on both the left and the right.
“The best explanation for the good old days is a bad memory”
How good was the past?
When thinking about the question, “How rich was the US in 1960?”, comparisons to other countries in 1960 aren’t very valuable. The US was the 7th richest country in the world on a per capita basis in 1960, but what does that actually mean? Today, the US is the 10th richest country in the world. Does that mean we’re worse off?
The problem is that the average American’s knowledge of what other countries lived like in 1960 is almost nonexistent, so relative comparisons to other countries in 1960 are virtually meaningless. Absolute comparisons are also difficult. Saying that US real GDP per capita has increased from $21k to $74k since 1960 or that the US’ child mortality rate has decreased from 30.1 to 6.6 since 1960 doesn’t mean much if you can’t imagine what a society with $21k of GDP per capita or a 30.1 child mortality rate is like. Without a good frame of reference, these improvements are just abstract numbers.
A better approach is to compare US metrics from 1960 against the same metrics from countries around the world today. This approach creates a better framework for comparison. So, let’s look at a few of those comparisons now.
GDP Per Capita
In 1960, US GDP per capita, adjusted for inflation, was $20,792. That earns the US in 1960 the 81st rank in the world by today’s standards, just ahead of the West African nation of Gabon and the resource-poor Balkan nation of Bosnia & Herzegovina. The export economy of Thailand is a little richer than 1960 US, and Mexico today is a full 6 places richer than 1960 US was. For reference, the US’ current GDP per capita has more than tripled since 1960 in real terms.

So, when answering the question “How rich was the US in 1960?”, one good answer would be to imagine Thailand or Mexico today. The US in 1960 was a little poorer than that.
To the extent this is surprising, remember that our perception of the past is warped by overly negative perceptions of the present. Not only was the US in 1960 not as rich as many people remember, but many third world countries today are also better off than many in the west realize because gradual improvements in these countries aren’t typically news-worthy.
Of course, GDP per capita doesn’t tell a complete story, especially for countries with high inequality, so let’s look at a few other metrics.
Child Mortality Rate
A country’s child mortality rate is an important metric for researchers because it reflects the relative success or failure of several key aspects of a society, including access to healthcare, nutrition, sanitation, and food security. Because it is related to so many contributing factors, it is usually considered a good catch-all summary metric for many aspects of a healthy society.

In 1960, the US had a child mortality rate of just over 30 per 1,000 children born, which today would position the US between India and South Africa at 142nd in the world. The US’ 1960 score would also fare considerably worse than Rwanda and Iraq today. Again, the US itself has seen considerable progress in its own child mortality rate since 1960.
Life Expectancy
Life expectancy tells a similar story – the US in 1960 had a life expectancy that today falls within the range of countries like Rwanda, Ethiopia, Egypt, and Sudan. Iraq again scores considerably better today than the US did in 1960.

Poverty
How about poverty? The data here is tougher to come by and there are a lot of ways to measure poverty, but the graph below looks at the percentage of a country’s population making less than $30/day. I chose this poverty line because it’s a little higher than the US’ current poverty line and is usually considered a good benchmark for comparing high-income countries.
Adjusted for inflation, over half of the US was living in poverty in 1960 by this metric, compared to just 14% in the US today.1

At 51%, the US in 1960 had a similar poverty rate to countries like Greece and Portugal today, so not exactly third world, but definitely not countries that are known for economic dynamism or that are on the leading edge of poverty eradication.
Urbanization
Many romanticized views of the 1960’s emphasize widespread homeownership in idyllic suburbs, but urbanization data shows why that romanticized view is problematic. In 1960, the US was still highly rural, with only 70% of the population living in urban or suburban areas – similar to the level of urbanization today in China, the Congo, Tunisia, and Iraq.

The idea of a highly urbanized America in the 1950’s and 60’s comes from comparisons to the traumatic preceding decades of the 1930’s and 40’s, when over half the population was still rural. While urbanization did increase rapidly in the postwar era, the US today is far more urbanized than it was in 1960. Additionally, the US’ current homeownership rate is also higher than it was in 1960, and it has remained remarkably consistent for the past 70 years.
Democracy
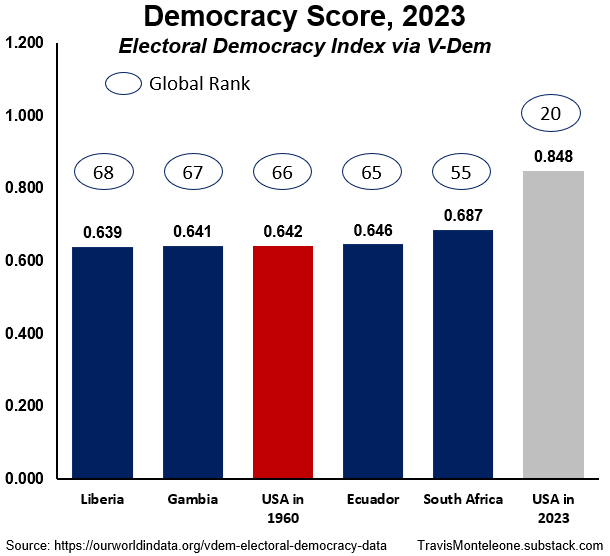
Some will also argue that more subjective aspects of society, such as institutions, were better in the 1960’s, but these arguments don’t typically stand up to scrutiny either. The graph below looking at V-Dem democracy scores provides one example.
V-Dem’s democracy index uses expert evaluations across a variety of factors to score countries on a scale of 0 to 1, with 1 being the most democratic. In 1960, the US had a democracy index score of 0.64, which today would place it slightly ahead of the West African nations of Liberia and Gambia and slightly behind Ecuador. 1960 US would notably rank 11 spots behind South Africa, whose recent democratic backsliding has been grabbing headlines. The US’ current democracy is much more secure than it was in 1960, despite what most news sources focused on negativity will tell you.
Why does this matter?
Again, these graphs show that the past is never as good as it seems and that progress in most metrics of wellbeing typically occurs too gradually to be recognized by the 24/7 news cycle. These two factors – romanticizing the past and catastrophizing the present – can combine to create dangerous perceptions of the world that are based in biased anecdotes rather than facts.
The results of overly negative worldviews are terrifying. Asked whether global extreme poverty has increased, stayed the same, or decreased over the last 20 years, not a single country surveyed had a majority of people answer correctly that extreme poverty had decreased. The actual decline was dramatic – from 31% to 9% in just 20 years – yet in the United States, a country known for its optimism, only 15% of people answered correctly that extreme poverty had decreased. 51% in the United States thought poverty had gone up.

So why does it matter if people in the US or other countries don’t know what’s happening around the world? For the vast majority of the developed world, only slim minorities believe the world is getting better. In the US, 6% of adults think the world is getting better. In Australia and France, that figure is 3%.

Pessimism globally is rampant and only getting worse. Without a good understanding of how our negativity addiction can manifest into a warped perception of the past and present, it can be easy to fall into the trap of blaming larger-than-life forces for every perceived evil.
If things really have gotten worse over the past 60 years, who should we blame? Politicians? Corporations? the Deep State? Neoconservatives? Capitalism? Liberalism itself? An overly negative view of reality is the perfect fuel for populist narratives. If people already believe the world is bad and getting worse, the job of the populist is easy – simply connect that pessimism with a nebulous and opaque enemy.
A key piece of depolarization work, therefore, is to combat populist fuel – namely overly negative worldviews that are rooted in biased perceptions of the past and present. Charts and data are helpful in dispelling many of these populist myths, but even more important is an understanding of why negative worldviews hold such an attraction in the first place. Negativity and pessimism are addictive in a literal sense, and the sooner we can recognize that addiction and resist it, the better.
The 14% figure, along with the comparable figures for the other countries shown, is an average of 2019 – 2023, due partly to broaden the base of countries with reportable data (not every country has data for every year), and also to help smooth some of the poverty swings due to covid.
I think you miss the point.
Everyone knows technology has gotten better since 1960. But they don’t credit this fact to our institutions or social norms. They credit it to “some stuff nerds reliably do that make us X% richer every year as long as we aren’t communists”.
So what they really want is 2025 technology combined with 1960 society. Amazon.com + 1960 crime rates. Central AC + 1960 marriage rates. Lower child mortality + 1960 fertility rates.
They seem to correctly understand that a working class person could acquire a wife, kids, and shelter in a safe neighborhood near their work in 1960. The home might have been smaller and it might have had less appliances, but it would have been a home with a family in a stable community.
In other words, the kind of stuff Charles Murray talks about in Coming Apart.
Myself, it’s clear from running the math that someone with my father’s job could not afford to live in the house I grew up in. Perhaps you could say this is a sign of economic growth (real estate got more expensive), but Something feels off about that.
A nice oasis in the sea of online doomposting, which definitely plays a role in the widespread negativity. I think you did a great job covering the analytical perspective. There’s certainly no rational reason for the negativity. I wonder if what you’ve observed can be explained better psychologically, or dare I say spiritually? I’m not sure if there are already coined terms out there to describe things like this, maybe you can be the first.
Nice work! Looking forward to more